Hanken’s carbon footprint increased in 2024

The result of the carbon footprint for 2024 reveals a complex picture of increased climate impact alongside with progress in some areas of operations. The footprint was calculated based on GHG Protocol Corporate Standard (2004) and Corporate Value Chain (Scope 3) Accounting and Reporting standard (2011). It includes emissions from Hanken’s own operations (Scope 1 and Scope 2) and all main contributors from the value chain of Hanken (Scope 3). The footprint excludes emissions from the Hanken Support Foundation, the subsidiaries (Fastighets Ab Hankens Isabella – 100% ownership) and associated companies Hanken & SSE Executive Education Ab - 50% ownership and Fastighets Ab Majsporten - 40% ownership).
Compared to calculations done in previous years, no new category has been added but a modification to the methodology to calculate emissions from purchased goods and services (Scope 3.1) was done. The major change is that instead of including only purchased services over 20,000 euros in expenditure, the calculation now includes all invoice-based purchased goods and services. The 2018 (base year) and 2023 footprints have also been revised accordingly.
The market-based emissions according to the GHG Protocol categories in 2024 are as follows:
- Scope 1: 0 tCO2e (direct emissions from owned or controlled operations)
- Scope 2: 76 tCO2e (indirect emissions from the use of purchased electricity, heating, and cooling in Hanken owned and operated facilities)
- Scope 3 Upstream: 1 937 tCO2e (value chain emissions, including purchased goods and services, fuel and energy related activities*, waste, business travel, commuting and teleworking)
- Scope 3 Downstream: 12 096 tCO2 (value chain emissions, including investment portfolio)
The carbon footprint per employee was calculated at 46 tCO2e, while the footprint per student was 7 tCO2e. When considering both employees and students, the footprint per person was 6 tCO2e. The numbers for 2018 were 41 tCO2e per employee, 7 tCO2e per student and 6 tCO2e per person.
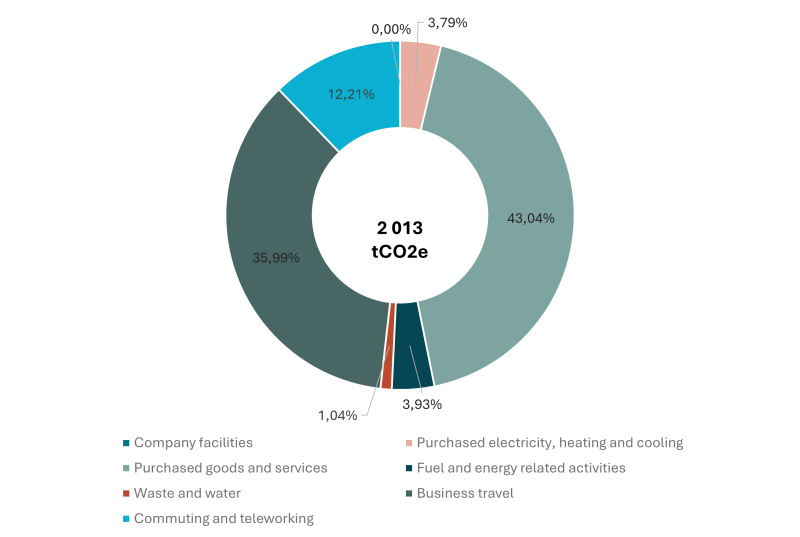
When emissions from the investment portfolio are set aside, the biggest emission sources are purchased goods and services (43 % of emissions) and travel (36 % of emissions) which includes travel for staff, guests and outgoing student mobility. Within purchased goods and services, food acquisition (lunches; 131 tCO2e) and other purchased goods and services (706 tCO2e) account for the biggest emissions over the IT assets (30 tCO2e) and paper (0 tCO2e). The category for other purchased goods and services includes for example construction and maintenance services (180 tCO2e), integration services for students (132 tCO2e) and catering services for Hanken events (77 tCO2e), as well as purchase of electronic materials and data (79 tCO2e). Commuting of employees and students and their teleworking accounts for the third largest share (12 % of emissions).
Investments remain the biggest single source of emissions from Hanken’s operations with 12 096 tCO2e in 2024. Emissions from investment portfolio were calculated based on received emission and emission intensity data from the asset manager Nordea (read more about their Environmental, Social and Governance (ESG) methodology here: https://www.nordeafunds.com/en/sustainablility/esg), and emissions from alternative investments were calculated based on the average emission factors and intensities that were also used in 2023. This however is a simplified approach, which should be developed further in the future to better describe the real emissions. Emissions from Hanken’s investments fluctuate year to year along with the value of the investment portfolio.

More detailed information about the carbon footprint 2023 can be found here:
Moving forward
As Hanken continues to navigate the complexities of achieving carbon neutrality, the latest carbon footprint underscores the need for a more comprehensive approach to emission reductions. The path forward will require innovative solutions and collective effort from all employees, students and stakeholders in Hanken’s value chain.
Key measures to reduce emissions in 2024 included development of a Climate Action Plan and updating of the travel guidelines to better consider the necessity of travel and encourage employees to travel land-based when possible. For example, a land-based trip may incur up to 30% higher costs compared to the fastest mode of travel. Work also started to better understand the ESG aspects of Hanken’s investment portfolio as well as its management in a sustainable way. The Climate Action Plan outlines a detailed plan to towards emission reductions across Hanken’s operations.
Hanken’s Environmental Programme for 2025-2026 also supports the environment and climate work. The programme can be found here.
For any questions and clarifications, please contact the Social Responsibility Coordinator Riina Haavisto at prme@hanken.fi.
*Fuel and energy related activities refer to indirect emissions from production of consumed electricity and heating – so called cradle-to-gate emissions from powerplant construction, transmission and supply losses.