Hanken’s carbon footprint decreased in 2025
The footprint includes emissions from Hanken’s own operations — direct emissions (Scope 1) and indirect emissions from purchased energy (Scope 2) — as well as the main contributors from Hanken’s value chain (Scope 3). The footprint was calculated based on the GHG Protocol Corporate Standard (2004) and Corporate Value Chain (Scope 3) Accounting and Reporting standard (2011).
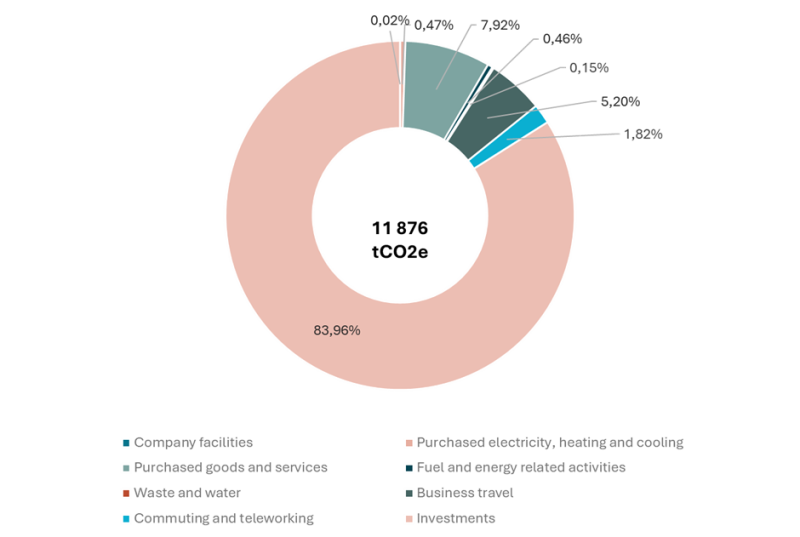
The emissions in 2025 are as follows:
- Direct emissions: 3 tCO2e (Scope 1)
- Indirect emissions from purchased energy: 56 tCO2e (Scope 2)
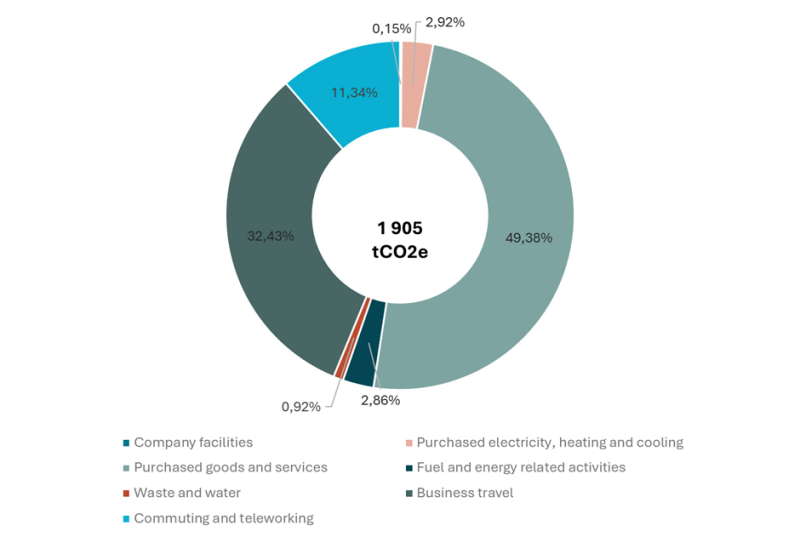
- Value chain emissions, upstream: 1 846 tCO2e (Scope 3 upstream: purchased goods and services, fuel and energy related activities, waste, business travel, commuting and teleworking)
- Value chain emissions, downstream: 9 972 tCO2e (Scope 3 downstream: investment portfolio)
The carbon footprint per employee was 37 tCO2e, while the footprint per person (employees and students combined) was 5 tCO2e. The trend is decreasing, with reductions of 8% and 19%, respectively, compared to 2018. Compared to calculation from previous years, no new categories have been added; however, the footprint covers a broader range of purchased services than in 2024, with IT licences being the largest addition.
Investments the main source of emissions
Investments remain the largest source category of emissions from Hanken’s operations with the share of 84% in 2025. The decrease in emissions of investments was the main contributor to the decrease of Hanken’s overall carbon footprint compared to 2024 but compared to 2018 emissions of investments increased by 4%. Emissions from the investment portfolio were calculated using emission intensity data provided by the asset manager Nordea. For alternative investments, average emission factors and intensities (emissions/€) from previous years were applied. This is a simplified method and should be improved in the future to better reflect actual emissions.
Including investmentportfolio
Excluding the investment portfolio, the main emission sources are purchased goods and services (49 % of emissions) and travel (32 % of emissions) including staff, guest travel and outgoing student mobility. Commuting and teleworking of employees and students account for 11 % of the total emissions, excluding investments. Within purchased goods and services category, services account for the majority of emissions (70%). Key contributors in this category include lunches, student integration services, as well as construction and maintenance activities.
Excluding investment portfolio
More detailed information about the carbon footprint 2025, as well as the changes from previous years, can be found here:
Moving Forward
Reducing Hanken’s carbon footprint will require new solutions and joint efforts from employees, students and stakeholders in Hanken’s value chain.
Hanken has developed a Climate Action Plan to achieve its climate targets:
- Carbon neutrality by 2030 for direct emissions (Scope 1) and emissions from purchased energy (Scope 2)
- Halving emissions from the value chain (Scope 3 upstream) by 2030.
- A dedicated goal and plan for the investment portfolio (Scope 3 downstream) to be introduced in 2026.
Key actions include improving energy efficiency in Hanken’s buildings, reducing waste, promoting responsible procurement and purchases, and encouraging responsible travel and commuting. The plan also emphasises climate change adaptation measures and understanding better the biodiversity impacts of operations for reduced environmental impacts.
*Market-based. Location-based carbon footprint: 12 000 tCO2e
For any questions, please contact Environmental Sustainability Coordinator Minna Torsner at prme@hanken.fi.